Monitask
Monitask is a simple, compact and flexible monitoring solution inspired by RRD and Munin tools and developed to minimize the load when configuring, collecting and displaying system health metrics.
Simple
All configuration is done via .INI files. Commands sections provide shell commands that allow to collect system metrics. Display sections explain how to interpret metrics and display them on graphs.
Compact
Having a minimal footprint, Monitask does not need additional tools on your server to generate interactive graphs representing your server activity.
Round-robin database concept is used to register server activity in a simple text CSV file. With default settings, tracking activity for 20 metrics and 4 periods (by day, week, month and year) only takes about 3.5MB of disk space.
Flexible
Monitask is designed from the start so that storage and display be easily extended via plugins. This allows storing metrics data on virtually any support, like in plain-text file, a compressed file, in a database or another support. Results may be output in text mode, on an HTML page with interactive graphs or in any other form.
Since platforms and architectures may vary, default commands and configurations may be rewritten by platform-specific .INI files.
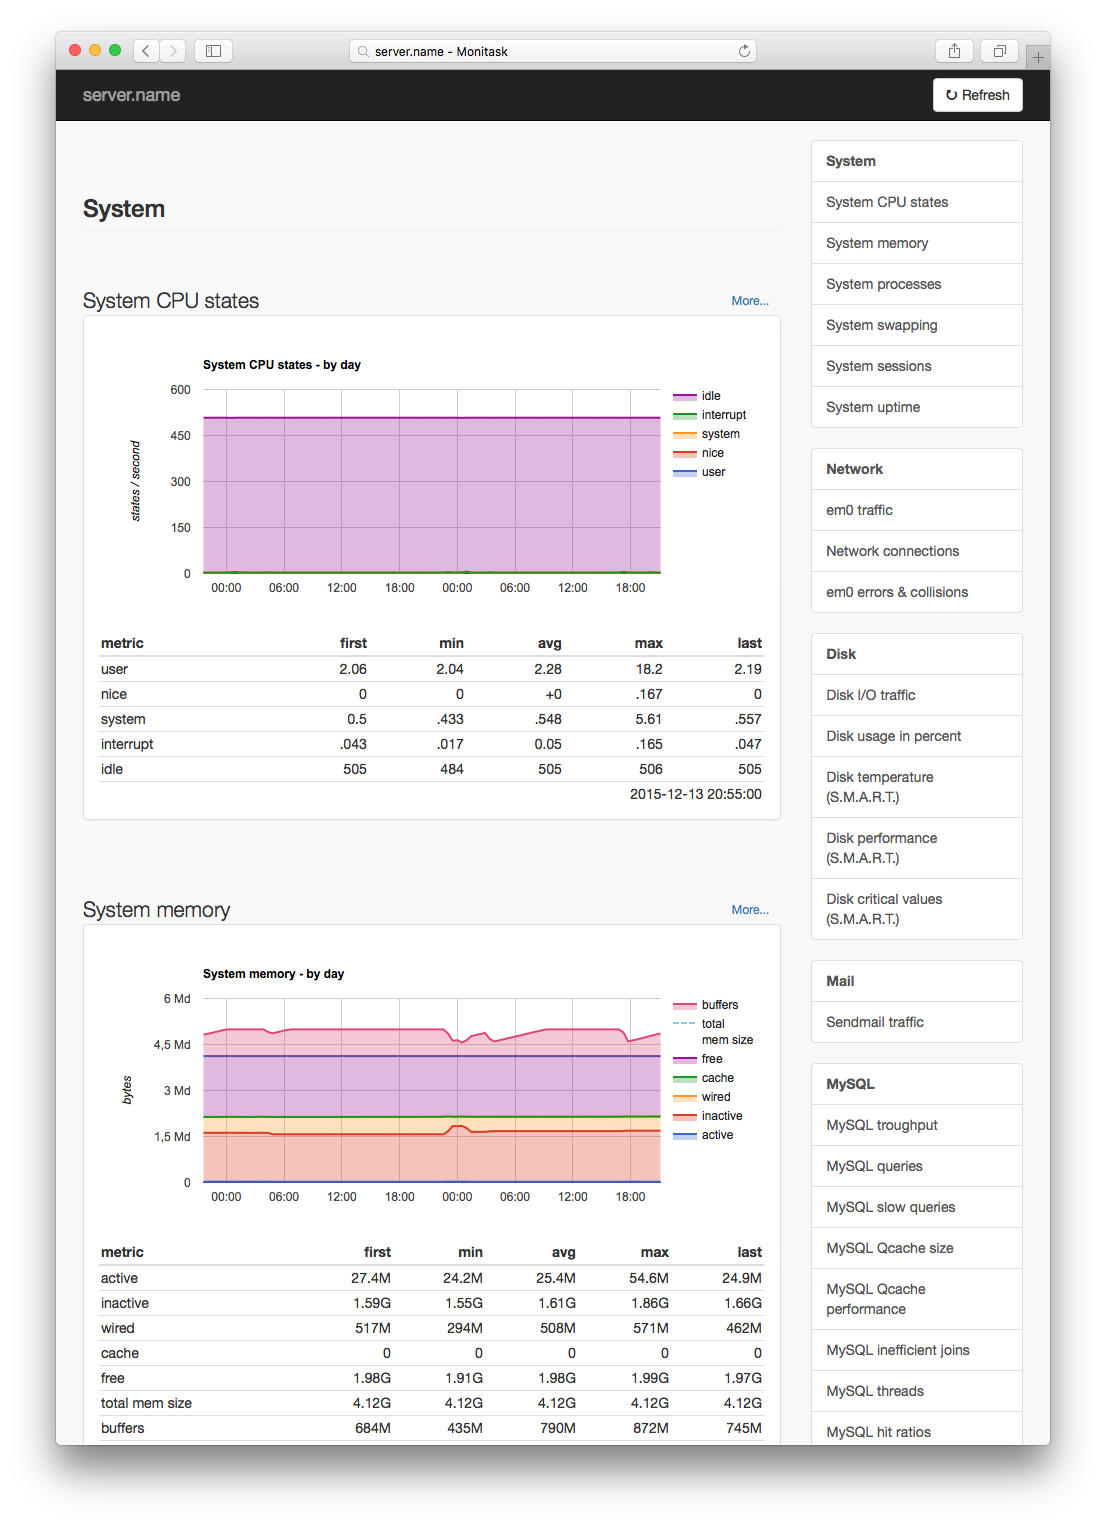
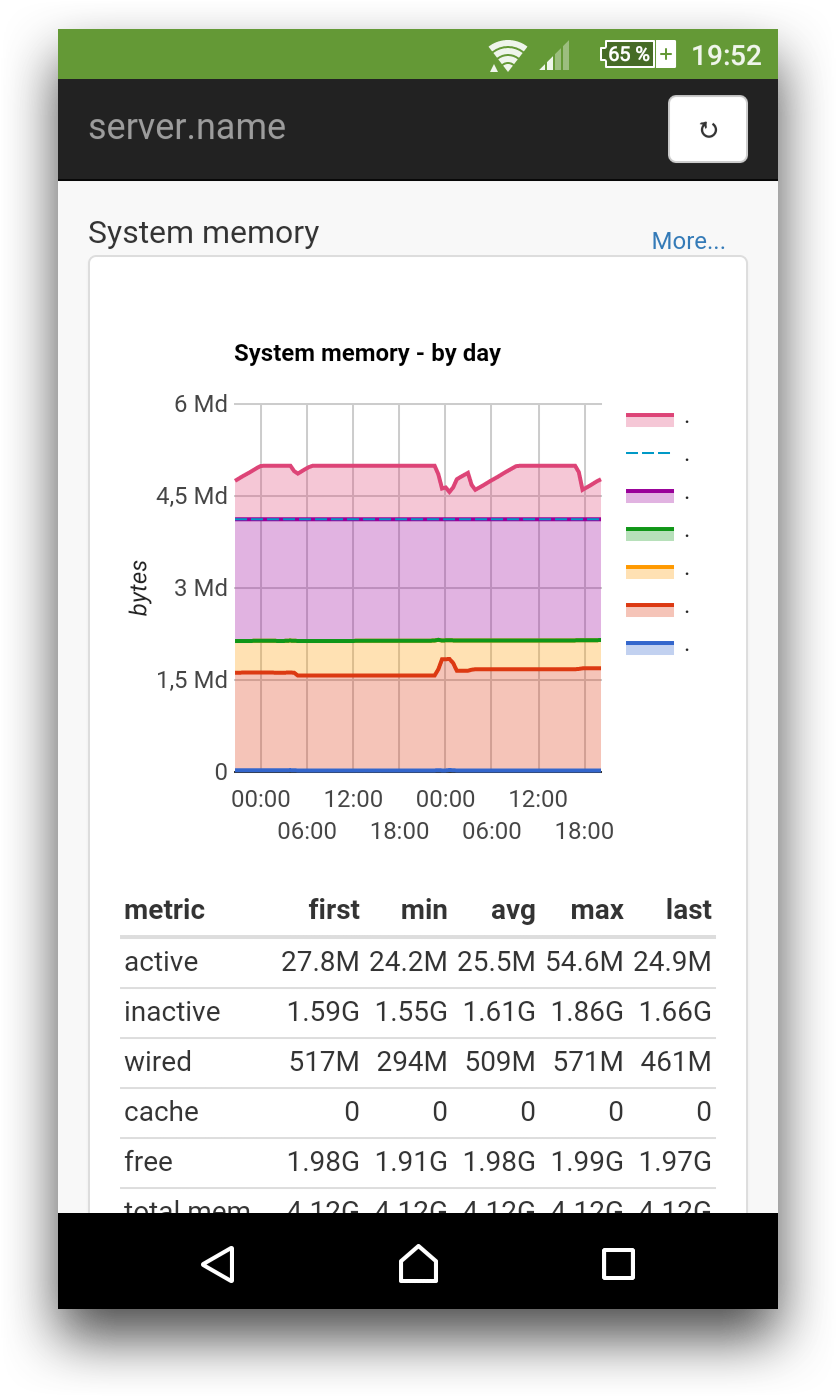
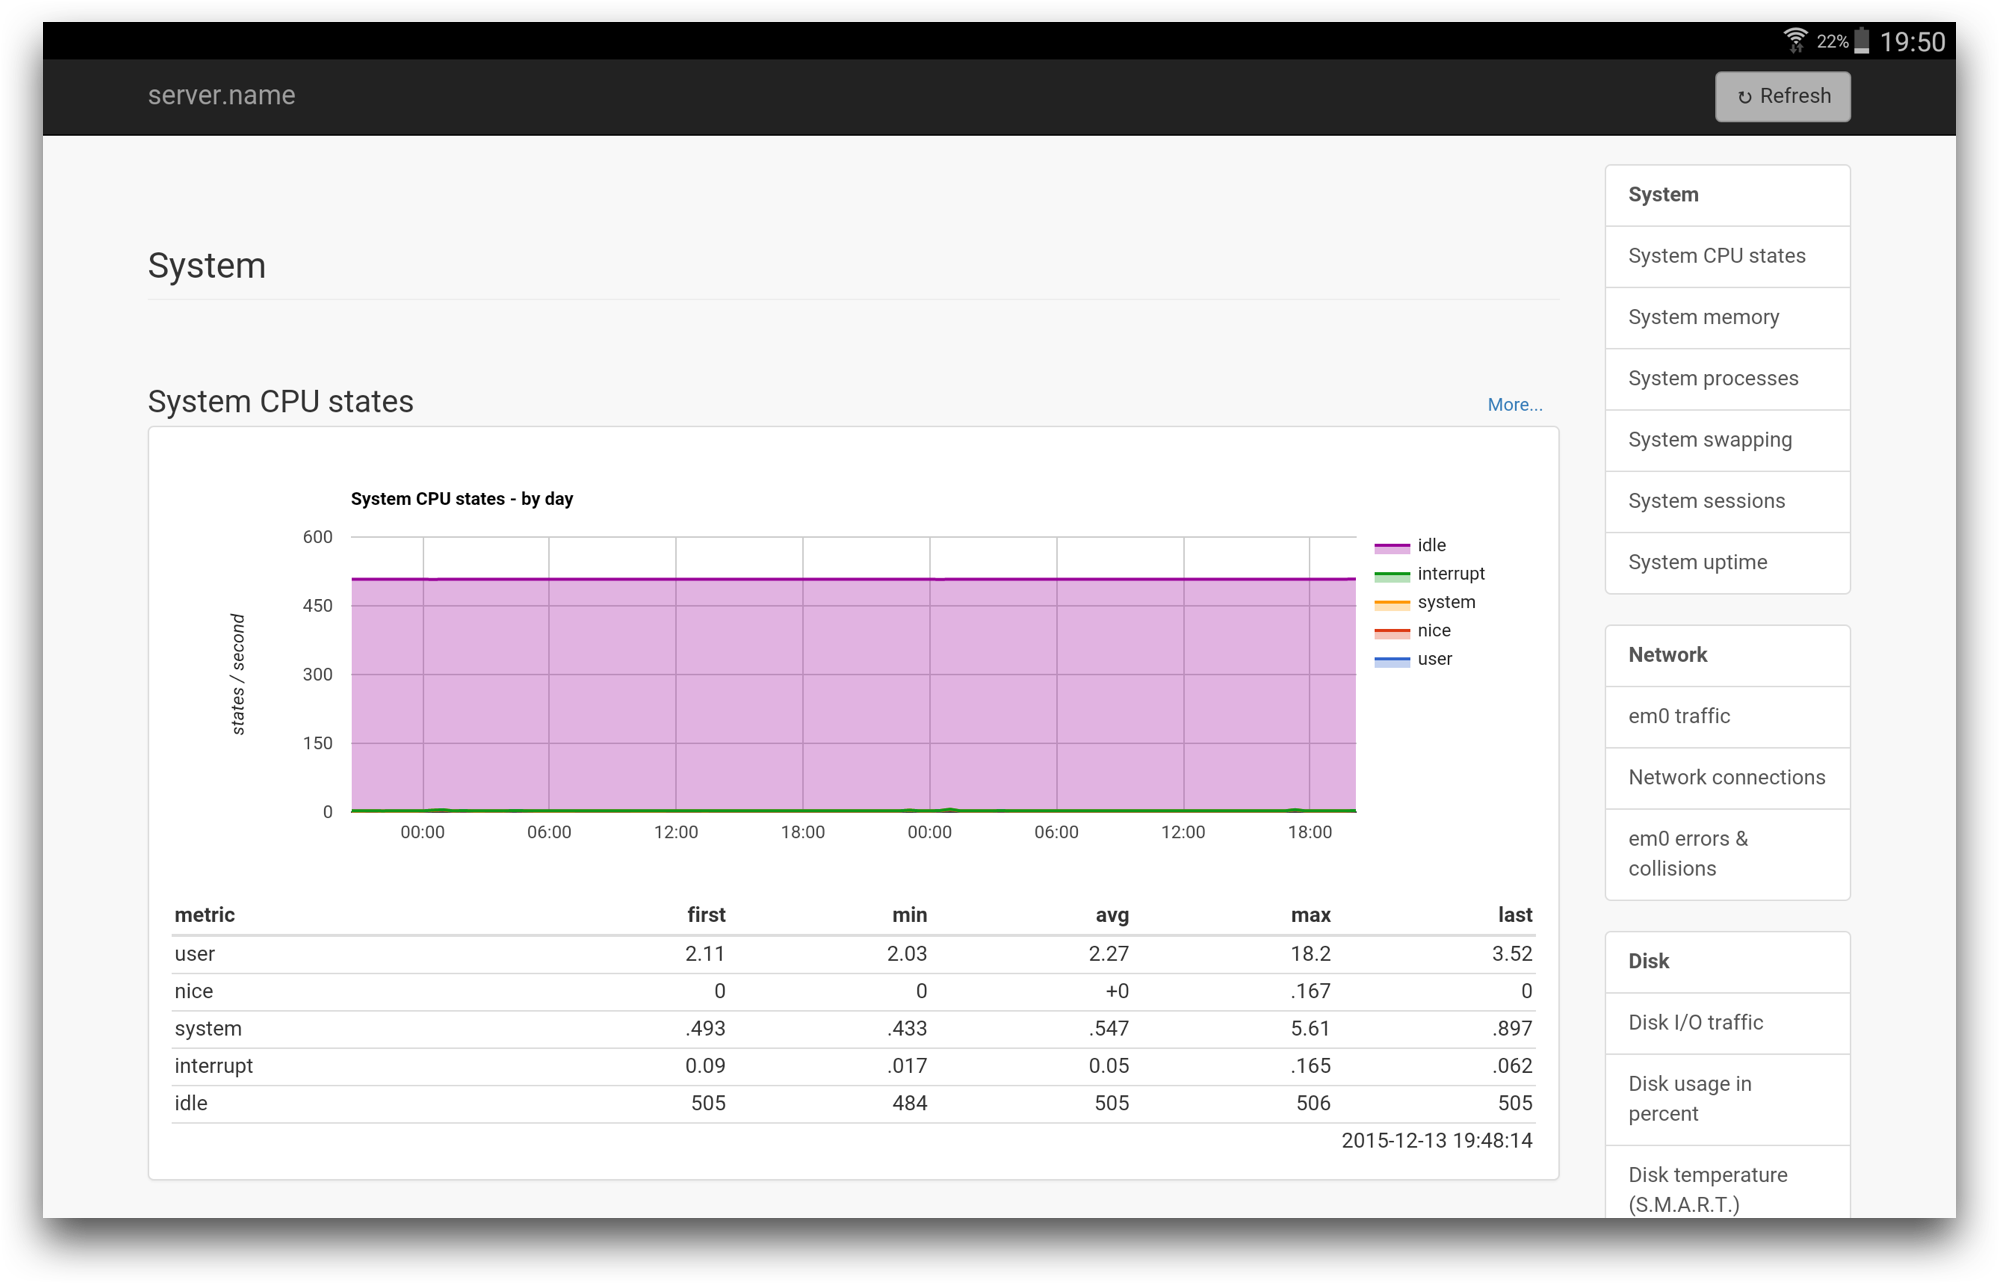
Screenshots
Documentation
For installation and configuration instructions please see our wiki documentation.